The stem pulled into the ground
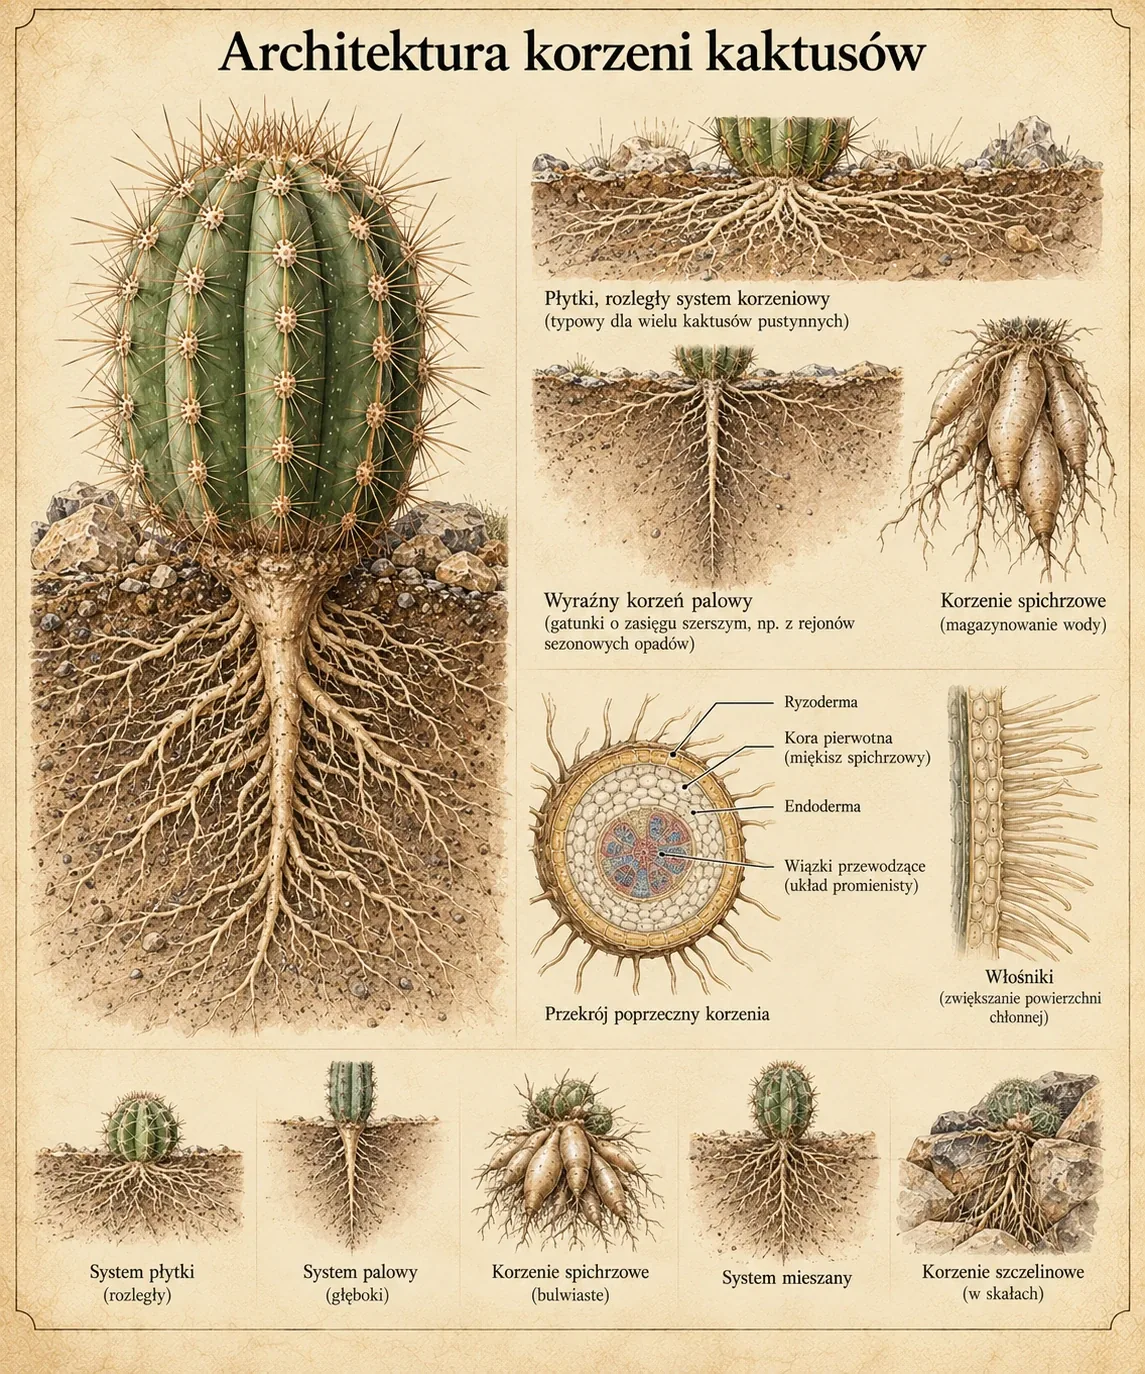
Pediocactus bradyi grows on calcareous substrates in northern Arizona. Its small stem lies close to the soil surface. During drought, the roots shorten and pull it below this surface. When moisture conditions improve, the plant can emerge again. This changes the position of its body relative to the air and ground. The buried stem remains a living part of the same plant. [Rojas-Pimentel et al. 2026, pp. 1–3]
Root contraction in this case is a movement of the whole plant resulting from a change in the length of an underground organ. The 2026 study by Rojas-Pimentel and co-authors tracked the occurrence of this movement in the field. Its main subjects were cactus survival, growth and reproduction. Cellular details of root contraction and the temperatures of stems below and above the surface were not measured. Protection from adverse conditions was considered on the basis of observed seasonal behaviour. [Rojas-Pimentel et al. 2026, pp. 2–4]
Thirty-one years of individual histories
The material comprised 965 marked plants in three plots, Badger, Soap Creek and North Canyon, on off-reservation Navajo Nation trust lands in the Marble Canyon area. The authors described the database as a 31-year series from 1988–2019. Each history combined size measurements with information on flowering, survival and burial. Such records allow the reappearance of the same specimen after a period of invisibility to be recognised. [Rojas-Pimentel et al. 2026, pp. 2–3]
The buried state required a separate category in the records. A cactus was not considered dead until it had remained in this state for more than five years. Two deaths of buried plants were recorded in the entire series. The authors treated them as rare and assumed zero mortality for this state in the model. This assumption makes the calculations clearer, but also defines the scope of the result. The model describes population dynamics with this simplification of survival histories. [Rojas-Pimentel et al. 2026, pp. 3–4]
Diameter as a measure of life stage
Plant size influenced most of the processes studied. The probability of survival and flowering increased with diameter. The probability of burial decreased and mainly concerned small stems. A larger diameter may be associated with greater water reserves, but storage capacity was not measured in this study. The authors presented it as a biological explanation consistent with the observed relationship between survival and size. [Rojas-Pimentel et al. 2026, pp. 4–6]
Diameter growth slowed above approximately 35 mm. This point applies to the fitted model of the sample studied. Reproductive capacity appeared earlier, as flowering was also recorded at a diameter of 10 mm. Small size and young age are separate characteristics. Site conditions and successive growing seasons can lead to different sizes in plants with similar life histories. The model therefore used measured diameter as its size variable, with age not inferred from appearance. [Rojas-Pimentel et al. 2026, pp. 3–6]
How the model combines individual fates
The authors used an integral projection model, abbreviated IPM. Size is a continuous variable in this model. For a plant of a given diameter, the model determines its probability of survival, the distribution of possible sizes in the next period and its contribution to the production of new plants. It separately describes transitions between visible and buried states. Combining these processes yields the predicted size structure and the long-term rate of change in abundance. [Rojas-Pimentel et al. 2026, pp. 3–4]
The coefficient λ describes the population growth rate resulting from the model. A value above one indicates a modelled increase in abundance, below one a decrease, and one maintenance of the number of plants. It does not represent the annual increase in diameter of a single cactus. The analysis compared a version containing the transition to the buried state with one from which this process had been removed. This was a mathematical comparison. Root contraction was not experimentally blocked in plants in the field. [Rojas-Pimentel et al. 2026, pp. 3–5]
A small change in the rate for the whole population
The average model gave λ = 1,041 when root contraction was included and λ = 1,044 in the version omitting entry into the buried state. The results were similar. The buried state involved approximately 10% of plants, mainly small ones. The proportion of these individuals and the time spent outside growth and reproduction limited the effect of contraction itself on the overall population rate. [Rojas-Pimentel et al. 2026, pp. 4–6]
Burial may help a particular specimen survive an adverse period. At the population level, this period also includes temporary withdrawal from growth and flowering. After survival of drought, re-emergence becomes important. In the model studied, root elongation and the return of the stem to the visible state had a greater positive effect than entry into burial alone. The result links protection of an existing plant with its subsequent contribution to population development. [Rojas-Pimentel et al. 2026, pp. 5–7]
Which processes had the greatest effect
Elasticity describes the relative response of λ to a small relative change in a given parameter. It allows processes expressed in different units to be compared. The highest value was obtained for survival. Changes in the size of visible stems also had a strong effect. These are local properties of the fitted model, assessed with the other parameters held at the same levels. [Rojas-Pimentel et al. 2026, p. 6, Table 2]
| Process | Elasticity of λ |
|---|---|
| Survival | 0,39 |
| Stem growth in the visible state | 0,24 |
| Root elongation and exit from burial | 0,17 |
| Growth after the buried state | 0,15 |
| Entry into the buried state | −0,01 |
For example, an elasticity of 0,39 means that a very small increase of 1% in the given survival parameter would be associated with an increase in λ of approximately 0,39% in this model. The negative value for entry into burial describes a small decrease in the modelled rate as this transition increases. These numbers are measures of model sensitivity. They do not give the percentage of plants saved or the contribution of roots to the water balance. [Rojas-Pimentel et al. 2026, pp. 3–4, 6, Table 2]
Weather changes demographic conditions
The root-contraction model did not directly include climate variables. A separate 2014 paper by Shryock and co-authors analysed a 22-year demographic record together with weather. A model with randomly varying years gave λs = 0,961. Higher annual precipitation and warmer winters were associated with a higher growth rate. Simulations of more frequent droughts reduced it. The result applies to a different range of data and a different way of incorporating variation between years. [Shryock et al. 2014, publication abstract]
The similar λ values in the two versions of the 2026 model concern the question of the contribution of root contraction. The λs value from the climate analysis concerns population persistence under a variable sequence of conditions. A comparison requires this distinction to be retained. A constant average model does not encompass the full sequence of dry and wet years, which may determine survival and seedling emergence. [Rojas-Pimentel et al. 2026, pp. 6–7][Shryock et al. 2014, publication abstract]
The visible stem and site persistence
A similar observational problem occurs in P. winkleri. Twenty years of monitoring of one plot in Capitol Reef tracked plants that appeared in spring and retreated after producing seeds. At the end of the series, some marked specimens remained invisible and their status was undetermined. Records of individual histories allowed this information to be retained alongside confirmed deaths. Recruitment was assessed through the appearance of new plants, with an increase in the number of visible stems alone insufficient to establish it. [Clark et al. 2015, pp. 89–96]
For the P. bradyi population studied, long survival, growth and the ability to return to an active state after burial were most important. Larger plants flowered more often and retreated less frequently. Their loss therefore affects both the current number of living specimens and part of the potential for future reproduction. Contractile roots remain one process in this life history, whose importance can be assessed only together with the plant's subsequent fate. [Rojas-Pimentel et al. 2026, pp. 5–7]
Root contraction does not increase long-term population growth in Pediocactus bradyi, an endangered cactus of Northern Arizona
Rojas-Pimentel J., Larios E., González E. J., Root contraction does not increase long-term population growth in Pediocactus bradyi, an endangered cactus of Northern Arizona, AoB PLANTS, 2026, 18(1):plaf074, doi: 10.1093/aobpla/plaf074
An analysis of 31-year histories of 965 Pediocactus bradyi plants. The integral projection model links size with survival, growth, flowering, retreat below the surface and re-emergence. A model incorporating root contraction was compared with one omitting the process. Survival and growth had the greatest influence on dynamics, and emergence from the concealed state had greater elasticity than entry into it.
Effects of Ungulate Disturbance and Weather Variation on Pediocactus winkleri: Insights from Long-Term Monitoring
Clark D. J., Clark T. O., Duniway M. C., Flagg C., Effects of Ungulate Disturbance and Weather Variation on Pediocactus winkleri: Insights from Long-Term Monitoring, Western North American Naturalist, 2015, 75(1):88-101, doi: 10.3398/064.075.0110
Twenty years of monitoring of one Pediocactus winkleri plot in Capitol Reef. Diameter, flowering, deaths, appearance of new plants and signs of disturbance by ungulates were recorded. Repeated trampling was associated with greater mortality and a lower chance of flowering. Relationships with temperature differed between spring stages. A small number of larger plants made a substantial contribution to flower production.
Population viability of Pediocactus bradyi (Cactaceae) in a changing climate
Shryock D. F., Esque T. C., Hughes L., Population viability of Pediocactus bradyi (Cactaceae) in a changing climate, American Journal of Botany, 2014, 101(11):1944-1953, doi: 10.3732/ajb.1400035
A demographic model based on 22 years of data and linked to rainfall and temperature. Population growth rate was analysed under varying sequences of years and scenarios of more frequent droughts and extreme rainfall. The model indicated population decline and additional risk with more frequent droughts.