Two landscapes of one species
Lophophora williamsii (formerly Anhalonium williamsii) occurs in two different vegetation systems in Texas. Southern populations occupy Tamaulipan thornscrub. Western populations grow in Chihuahuan Desert vegetation. In both regions, they are associated with calcareous soils, but elevation, temperature, rainfall and terrain differ. In 2019, Ermakova and colleagues compared three populations from each region to obtain measurements of their basic structural traits. [Ermakova et al. 2021, pp. 149–151]
Land access required owners' permission. Each selected location contained a previously known cactus population, so the six sites formed a sample of places particularly important for conservation. Random selection of measurement plots within these locations reduced selection of plant clusters alone. It did not remove the prior selection of sites based on the species' known presence. [Ermakova et al. 2021, pp. 150–152, 157]
Random sampling within suitable habitat
The researchers delineated accessible portions of suitable habitat. These included calcareous substrate and vegetation without visible signs of previous conversion to farmland, deep scrub removal or construction. Areas beside watercourses and intermittent channels were excluded. Boundaries were established from soil maps, aerial photographs and spatial data, while the terrain was checked directly along transects. Habitat assessment outside them therefore remained partly cartographic. [Ermakova et al. 2021, pp. 151–152, 157]
A geographic information system was used to select random transects 25 m long and 4 m wide, oriented north to south. Neighbouring parallel plots were separated by at least 250 m along the east–west axis. A total of 121 transects, or 1,21 ha, were studied. Work was conducted in May and July 2019. Plot numbers at individual sites ranged from five to 31 because time constraints and land accessibility were also considered. [Ermakova et al. 2021, pp. 150–152]
Clusters among empty plots
A total of 294 plants were found across all transects, but only 14 plots contained any specimens. No cactus was recorded in the remaining 107. This indicates strong spatial clustering within the habitats studied. At one southern site, all 53 plants were found on one of 26 transects. At the western site with the highest density, plants occurred on four of five plots. Variation among these results influences the precision of the mean. [Ermakova et al. 2021, pp. 155–157, Table 6]
| Region and site | Transects with plants / all transects | Number of plants | Density on transects (ha⁻¹) |
|---|---|---|---|
| South, site 1 | 4 / 27 | 71 | 262,96 |
| South, site 2 | 3 / 31 | 73 | 235,48 |
| South, site 3 | 1 / 26 | 53 | 203,85 |
| West, site 4 | 1 / 14 | 25 | 178,57 |
| West, site 5 | 1 / 18 | 26 | 144,44 |
| West, site 6 | 4 / 5 | 46 | 920,00 |
Density has its own denominator
Overall density was about 243 plants per hectare of transects studied. It was calculated by dividing 294 specimens by 1,21 ha. It therefore concerns randomly selected plots in accessible portions of suitable habitat at six known sites. The authors did not extrapolate this number to all of Texas. The strongly patchy occurrence and lack of full field verification of habitat outside transects also limited the precision of estimates for entire properties. [Ermakova et al. 2021, pp. 155–157]
Individual values ranged from 144,44 to 920 plants per hectare. The exceptionally high value came from a site with five transects checked. After excluding it, density on the remaining plots was about 214 plants per hectare. This analysis shows the influence of one location on the combined result. The study did not confirm a uniform density difference between south and west, although individual plant size differed significantly. [Ermakova et al. 2021, pp. 156–157]
The crown as the unit of measurement
A crown is the photosynthetic stem portion visible above ground. The authors measured its shortest and longest diameters and then used their mean to calculate hemispherical volume. When several crowns were present, they added their volumes. They treated cacti whose crowns touched as one plant and separated cacti as distinct plants. This is an explicit definition of the field counting unit. It is not based on excavating and tracing the entire system of underground connections. [Ermakova et al. 2021, p. 152]
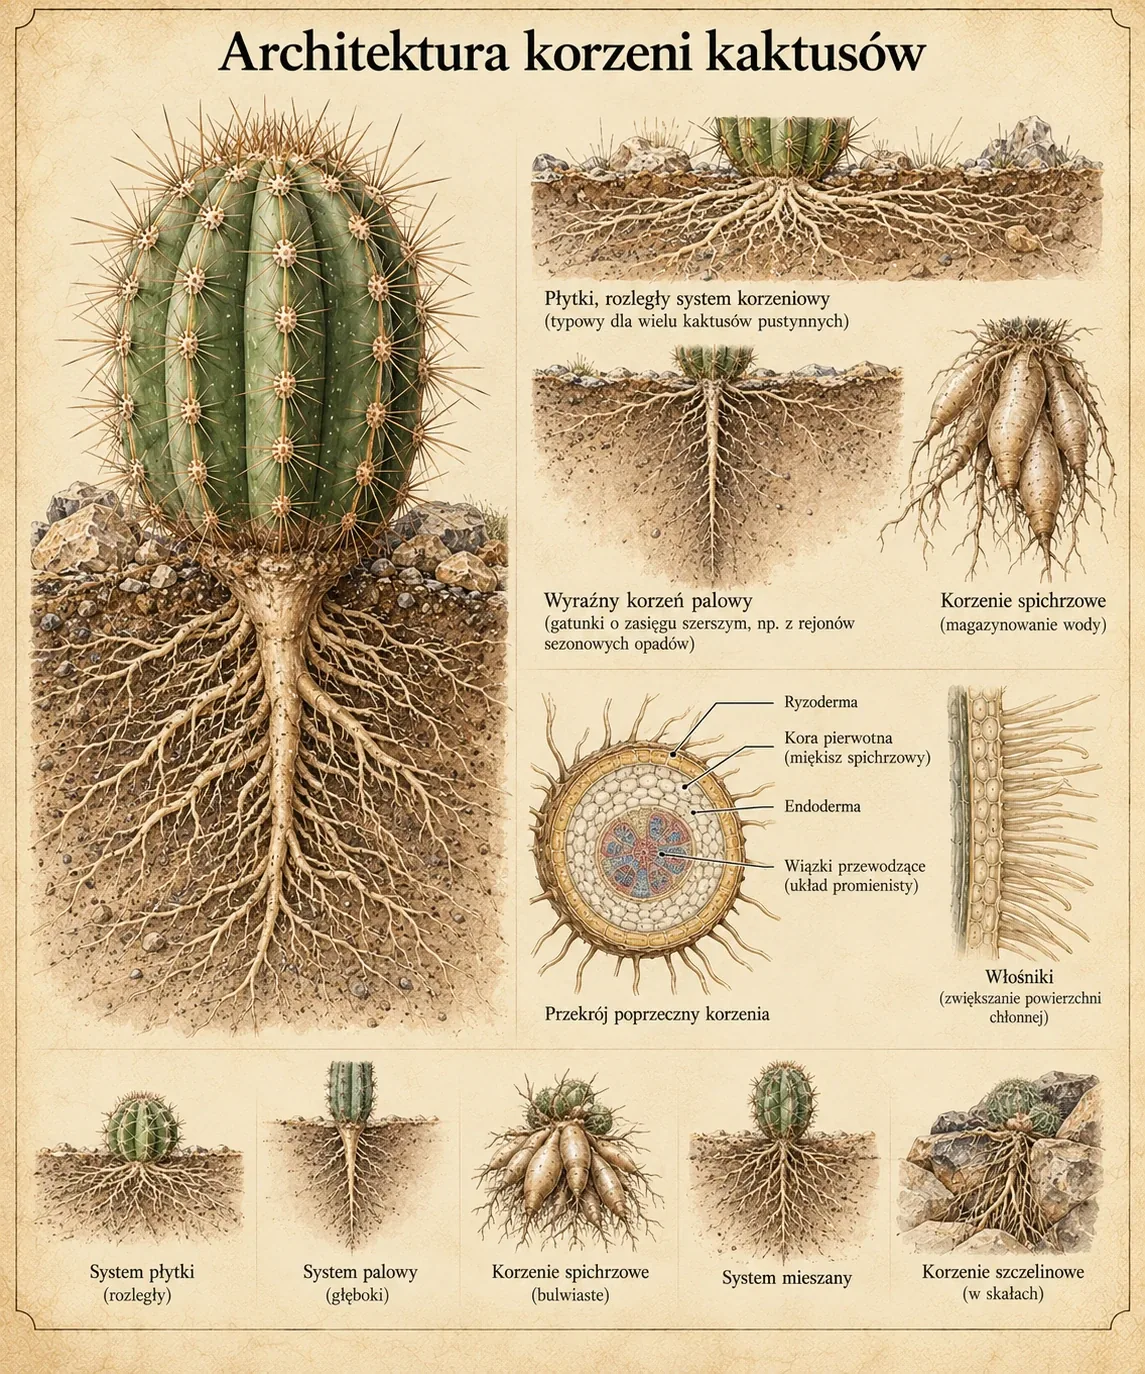
In the sample, 77% of plants had one crown, 14% had two and the remainder three to seven. Branches can appear during ageing, after herbivory or removal of the apex. Anatomical studies also show that replacement shoots can form their own roots and gradually begin an independent clonal existence. A multicrowned cluster viewed from above can therefore represent one branched specimen or closely growing units with different origins. [Ermakova et al. 2021, Ermakova et al., pp. 152, 156–158. Terry and Mauseth, pp. 567–581] [Terry and Mauseth 2006, Ermakova et al., pp. 152, 156–158. Terry and Mauseth, pp. 567–581]
Larger plants in the west
Estimated above-ground volume was significantly greater in western Texas. After back-transformation from logarithmic values, the analysis means corresponded to about 53,11 cm³ in the west and 8,95 cm³ in the south. These values accounted for the hierarchical sample structure. Simple arithmetic means calculated for all specimens together were about 95 and 22 cm³, respectively. The difference results from an asymmetric size distribution in which a few large plants strongly influence the ordinary mean. [Ermakova et al. 2021, pp. 153–155]
Western sites were also higher, cooler, drier and more steeply sloping. This association among variables makes it difficult to determine which caused the size difference. The authors also considered less competition from other plants, different harvesting pressure and genetic differences. These explanations remained hypotheses. Cross-sectional measurements of six populations do not separate their influences or establish an individual specimen's growth rate. [Ermakova et al. 2021, pp. 154–155, 158]
Slope aspect and the range boundary
In the western part of the sample, 65% of plants grew on south-facing slopes and 35% on west-facing slopes. These aspects occupied 33% and 18% of the area studied, respectively. Cactus presence was therefore associated with slope aspect as well as the frequency of individual aspects. No specimens were found on northern and eastern transects, which describes the sample scope and does not exclude occurrence outside it. [Ermakova et al. 2021, pp. 155–156]
The authors linked this result to the potential benefit of warmer microsites at the northern range boundary. This was a biogeographical interpretation without temperature measurements for each crown or experimental determination of cold tolerance. Shrub canopy shelter, slope aspect and regional climate act at different scales and can coexist in one habitat. [Ermakova et al. 2021, p. 158]
From structure to population dynamics
The size distribution included many smaller plants and few large ones. This pattern can accompany regular emergence of new individuals, but a similar distribution can also arise from episodic germination and varied subsequent growth. Crown size is not a simple measure of age. Damage and regeneration further alter its dimensions. Establishing reproductive success requires identification of seedlings and monitoring of their subsequent fate. [Ermakova et al. 2021, pp. 156–158]
The next stage of conservation assessment involves repeating measurements on marked plants. Survival, growth and seedling recruitment in successive years establish whether a local population increases, remains stable or disappears. The 2019 study provides a detailed structural picture of six sites. Terry's regeneration series adds knowledge of one process that can alter individual size and survival. Both scopes of data remain linked to a particular region and the histories of the plants studied. [Ermakova et al. 2021, Ermakova et al., pp. 157–158. Terry et al. 2014, pp. 548–549] [Terry et al. 2014, Ermakova et al., pp. 157–158. Terry et al. 2014, pp. 548–549]
Measurements of six known populations in May and July 2019 were published in 2021. The study presents spatial structure and plant size. Regeneration observations come from separate papers by Terry and colleagues.
Densities, plant sizes, and spatial distributions of six wild populations of Lophophora williamsii (Cactaceae) in Texas, U.S.A.
Ermakova A., Whiting C. V., Trout K., Clubbe C., Terry M. K., Fowler N., Densities, plant sizes, and spatial distributions of six wild populations of Lophophora williamsii (Cactaceae) in Texas, U.S.A., Journal of the Botanical Research Institute of Texas, 2021, 15(1):149-160, doi: 10.17348/jbrit.v15.i1.1057
Measurements taken in May and July 2019 cover six known populations, 121 random transects and 294 plants. The authors analyse clustered distribution, density, crown number and above-ground volume. They compare southern and western Texas, examine slope aspect and discuss the extent to which the data can support conservation assessment.
Root-shoot anatomy and post-harvest vegetative clonal development in Lophophora williamsii (Cactaceae: Cacteae): implications for conservation
Terry M., Mauseth J. D., Root-shoot anatomy and post-harvest vegetative clonal development in Lophophora williamsii (Cactaceae: Cacteae): implications for conservation, SIDA, Contributions to Botany, 2006, 22(1):565-592
The histological analysis of five plants of different sizes distinguishes features of the underground stem and root of Lophophora williamsii. The authors describe cortical bundles, pith, root conducting tissues and observations of regeneration and clonal branching after loss of the apex.
Limitations to natural production of Lophophora williamsii (Cactaceae) III. Effects of repeated harvesting at two-year intervals for six years in a South Texas (U.S.A.) population
Terry M., Trout K., Williams B., Herrera T., Fowler N., Limitations to natural production of Lophophora williamsii (Cactaceae) III. Effects of repeated harvesting at two-year intervals for six years in a South Texas (U.S.A.) population, Journal of the Botanical Research Institute of Texas, 2014, 8(2):541-550
The third report covers six years of the field experiment. It compares survival in separate two-year intervals, estimated plant size and changes in crown number. It also presents a statistical power analysis that limits conclusions about the degree of recovery after a single injury. Repeated injuries were associated with a smaller above-ground part and poorer survival.